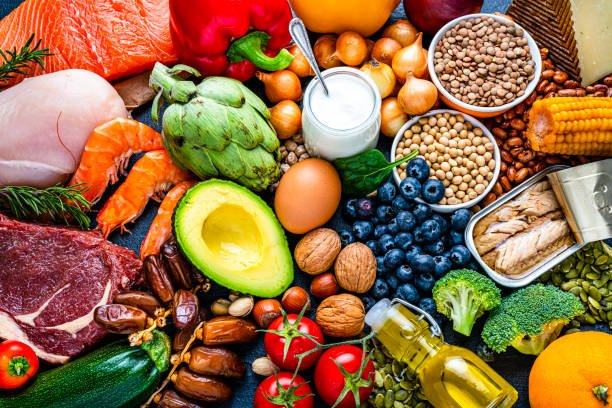
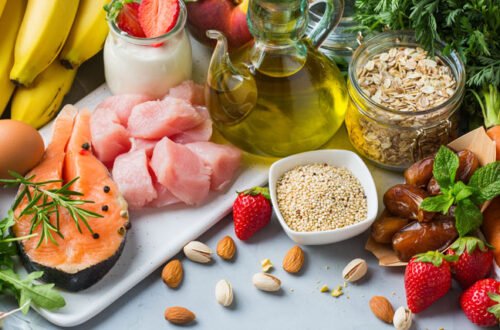
Imagine sitting down to dinner, wondering if your meal aligns with what the nation’s eating—or if it’s secretly sabotaging your health. That’s where the National Diet and Nutrition Survey (NDNS) comes in, a UK cornerstone for understanding what we eat, why it matters, and how it shapes public health. As someone who’s pored over food diaries to improve my own diet, I can tell you: knowing what’s on the nation’s plate is eye-opening. This article dives deep into the NDNS, exploring its purpose, methods, findings, and impact, all while keeping you engaged with practical insights and a touch of humor.
What Is the National Diet and Nutrition Survey?
The NDNS is the UK’s premier tool for tracking the nation’s diet and nutritional health, running annually since 2008. It collects detailed data on food consumption, nutrient intake, and nutritional status for people aged 18 months and older. This goldmine of information helps shape policies like the 5 A Day campaign and sugar reduction guidelines.
A Snapshot of the NDNS
Funded by the Office for Health Improvement and Disparities (OHID) and the Food Standards Agency (FSA), the NDNS surveys about 1,000 people yearly across England, Wales, Scotland, and Northern Ireland. It’s a cross-sectional study, meaning it captures a moment in time for a diverse, representative sample.
Why the NDNS Matters in 2025
With obesity rates climbing and nutrient deficiencies persisting, the NDNS is more critical than ever. Its data reveals trends—like the UK’s love affair with sugar—and informs policies to combat health issues. I once adjusted my diet after reading NDNS reports, cutting back on sugary drinks. It’s personal and powerful.
The Stakes of Poor Nutrition
Poor diets contribute to 1 in 5 deaths globally, according to the WHO. The NDNS helps identify gaps, like low fruit intake, guiding interventions to reduce heart disease and diabetes risks.
Public Health Impact
NDNS data underpins campaigns like the Eatwell Guide and informs the Scientific Advisory Committee on Nutrition (SACN). It’s the backbone of policies tackling salt, sugar, and obesity across the UK.
How the NDNS Works
The NDNS uses a robust methodology to ensure accurate, representative data. Participants are randomly selected from private households, and the survey combines interviews, food diaries, and biological samples. It’s a massive undertaking, but the results are worth it.
Stage 1: Computer-Assisted Personal Interview (CAPI)
Interviewers collect demographic, lifestyle, and health data via CAPI. This step sets the stage for understanding who’s eating what and why.
Stage 2: Dietary Assessment with Intake24
Participants record their food and drink intake over four non-consecutive days using Intake24, an online tool. When I tried a food diary, I was shocked to see how much salt sneaked into my meals.
Stage 3: Biological Samples
Blood and urine samples provide objective data on nutrients like vitamin D and folate. These biomarkers reveal deficiencies that self-reported diets might miss.
NDNS Methodology Comparison
| Method | Purpose | Strengths | Challenges |
|---|---|---|---|
| CAPI Interview | Gathers demographic/lifestyle data | Accurate, structured responses | Time-intensive for participants |
| Intake24 Diary | Tracks food and nutrient intake | User-friendly, detailed data | Relies on participant honesty |
| Blood/Urine Samples | Measures nutritional biomarkers | Objective, scientific accuracy | Invasive, requires lab analysis |
Pros: Comprehensive, nationally representative, supports policy-making.
Cons: Small sample size, potential recall bias in diaries.
Key Findings from NDNS 2019–2023
The latest NDNS report (2019–2023) paints a vivid picture of the UK’s diet. Spoiler: we’re still eating too much sugar and not enough veggies. Here’s what stands out.
Sugar and Saturated Fat Overload
The average adult consumes 8.4g of salt daily, 40% above the 6g recommendation. Free sugars exceed the 5% energy intake guideline, especially for kids aged 11–18 (12.5% for girls).
Fruit and Vegetable Shortfall
Only 33% of adults meet the 5 A Day target, with teens (11–18) averaging just 2.9 portions. My own struggle to hit five portions daily mirrors this trend—salads aren’t always exciting!
Nutrient Deficiencies
Low folate and vitamin D levels are widespread. For example, 19% of girls aged 11–18 have calcium intakes below the lower reference nutrient intake (LRNI).
Nutritional Inequalities
Higher-income households consume more fiber and fruit, while deprivation correlates with poorer diets. This gap hit home when I volunteered at a food bank and saw limited access to fresh produce.
NDNS and Public Health Policy
The NDNS isn’t just data—it’s a catalyst for change. Governments use its findings to craft policies that nudge us toward healthier eating.
Shaping the Eatwell Guide
The NDNS informs the Eatwell Guide, which promotes balanced diets. It’s why you see campaigns pushing for more veggies and less processed food.
Tackling Salt and Sugar
NDNS data drives salt and sugar reduction programs. For instance, the FSA uses it to assess chemical exposure in food, ensuring safety.
Supporting the 5 A Day Campaign
With only 17% of adults hitting the 5 A Day target, NDNS data fuels campaigns to boost fruit and vegetable intake.
How NDNS Data Is Collected and Analyzed
The NDNS is a well-oiled machine, run by the National Centre for Social Research (NatCen) and the MRC Epidemiology Unit. Its rigorous process ensures reliable results.
Random Sampling for Representation
Around 1,000 participants (500 adults, 500 children) are randomly selected to reflect the UK’s diversity. This ensures data applies to everyone, from city dwellers to rural folks.
Intake24: A Modern Dietary Tool
Since 2019, Intake24 has replaced paper diaries, making food tracking easier. It’s like a food journal with less guilt and more tech.
Biomarker Analysis
Blood and urine samples are stored in the NDNS Bioresource, available for health research. This objective data catches what diaries might miss, like hidden deficiencies.
Data Accessibility
Results are published on GOV.UK and accessible via the UK Data Service. Researchers can apply for bioresource samples for further studies.
Challenges and Limitations of the NDNS
No survey is perfect, and the NDNS faces hurdles that affect its data. Understanding these helps put its findings in context.
Small Sample Size
With only 1,000 participants annually, the NDNS may miss nuanced regional or demographic trends. Larger samples could offer deeper insights.
Recall Bias in Food Diaries
Participants might underreport unhealthy foods (guilty as charged—I once “forgot” a late-night chocolate binge). This can skew results.
COVID-19 Disruptions
Data collection paused from March to October 2020, impacting the 2019–2023 dataset. Adjustments were made, but gaps remain.
Pros and Cons of NDNS
Pros:
- Nationally representative data
- Objective biomarkers complement self-reports
- Drives evidence-based policy
Cons:
- Small sample limits granularity
- Recall bias in dietary diaries
- Costly and complex to administer
Tools and Resources for NDNS Participants
If you’re invited to join the NDNS, you’re contributing to public health. Here’s how to make it easier.
Using Intake24 Effectively
Intake24 is intuitive, but accuracy matters. Log meals immediately, and be honest—even about that extra biscuit. Participants get £20 in vouchers for completing all four diaries.
Accessing Support
Need help? Call NatCen’s free helpline at 0800 652 4572. They’ll guide you through the process, from interviews to diaries.
Where to Find NDNS Reports
Full reports and data tables are available on GOV.UK. They’re a treasure trove for health enthusiasts.
NDNS vs. Other Nutrition Surveys
How does the NDNS stack up globally? Let’s compare it to the U.S.’s National Health and Nutrition Examination Survey (NHANES).
NDNS vs. NHANES Comparison
| Feature | NDNS (UK) | NHANES (USA) |
|---|---|---|
| Population | 18 months+, private households | All ages, including institutions |
| Sample Size | ~1,000/year | ~5,000/year |
| Dietary Tool | Intake24 (4-day recall) | 24-hour recall (2 days) |
| Biomarkers | Blood, urine, spot samples | Blood, urine, physical exams |
| Frequency | Continuous since 2008 | Continuous since 1999 |
NDNS Strengths: User-friendly Intake24, focus on policy impact.
NHANES Strengths: Larger sample, broader health exams.
People Also Ask (PAA) Section
What does the National Diet and Nutrition Survey measure?
The NDNS tracks food consumption, nutrient intake, and nutritional status via interviews, Intake24 diaries, and blood/urine samples, focusing on the UK population aged 18 months and up.
How is NDNS data used by the government?
It informs policies like the Eatwell Guide, 5 A Day, and sugar/salt reduction programs, helping address obesity, deficiencies, and food safety.
Who funds the NDNS?
The Office for Health Improvement and Disparities (OHID) and the Food Standards Agency (FSA) jointly fund the NDNS, with NatCen and MRC leading operations.
Where can I access NDNS results?
Results are published on GOV.UK and the UK Data Service. Bioresource samples are available for research via application.
How to Use NDNS Insights in Your Life
NDNS findings aren’t just for policymakers—they’re for you. Here’s how to apply them.
Boost Your Fruit and Veggie Intake
Aim for 5 A Day by adding a portion to each meal. I started blending spinach into smoothies—barely noticeable but packs a punch.
Cut Back on Sugar and Salt
Check labels for hidden sugars and salts. NDNS data shows we’re eating 40% too much salt—small swaps like herbs over salt make a difference.
Monitor Your Nutrients
Low vitamin D or folate? Consider supplements or fortified foods, especially in winter. Consult a dietitian for personalized advice.
Best Tools for Personal Nutrition Tracking
- MyFitnessPal: Tracks food intake and nutrients, free with premium options.
- Cronometer: Detailed nutrient breakdowns, ideal for NDNS-inspired tracking.
- NHS Food Scanner App: Scans barcodes to check sugar and salt content.
SEO and Engagement Strategies for NDNS Content
Want to share NDNS insights online? Here’s how to make your content shine.
- Keywords: Use “NDNS 2025 results,” “UK diet trends,” or “nutrition survey insights” naturally.
- Links: Link to GOV.UK for NDNS reports and NHS.uk for dietary advice.
- Engage: Add polls like “Do you meet the 5 A Day target?” to spark discussion.
- Mobile-Friendly: Use short paragraphs and bold headings for easy reading on phones.
FAQ Section
1. What is the purpose of the NDNS?
The NDNS monitors UK diet and nutrition to inform health policies, track nutrient deficiencies, and ensure food safety.
2. How accurate is the NDNS data?
It’s highly accurate due to biomarkers and Intake24, though recall bias and small sample sizes can limit precision.
3. Can I participate in the NDNS?
If randomly selected, you’ll be invited by NatCen. Participation is voluntary, with incentives like £20 vouchers.
4. Where can I find NDNS data for research?
Access reports on GOV.UK or apply for bioresource samples via the NDNS Bioresource webpage.
5. How does the NDNS compare to other surveys?
It’s similar to NHANES but focuses on UK households with a smaller sample, emphasizing policy-driven outcomes.
Final Thoughts
The National Diet and Nutrition Survey is more than a data dump—it’s a window into the UK’s health, guiding us toward better choices. When I first read an NDNS report, I was stunned to learn how much sugar I was unknowingly consuming. By understanding its findings and applying them, you can take control of your diet while contributing to a healthier nation. Dive into the reports on GOV.UK, try tools like Intake24, or call 0800 652 4572 if you’re invited to participate. Your plate matters, and the NDNS proves it.


